AI-Powered Visual Generation

Visuals from text. Instantly.

GenVisual turns your ideas into professional diagrams and charts in seconds. No design skills required. Just type and create.

Input
"OpenAI's strengths and weaknesses"
SWOT diagram showing OpenAI's strengths and weaknesses including technology leadership and ethical concerns

How it works

From raw text to polished visual in four simple steps.

Paste your text

Input your content, select a template, theme, and font (optional). No complex prompting required.

Generate visuals

Our AI instantly creates relevant diagrams, charts, and infographics from your text.

Customize style

Adjust the generated visuals by changing the theme and font to match your brand.

Export & Share

Download your visuals in high-quality PNG or SVG formats ready for any platform.

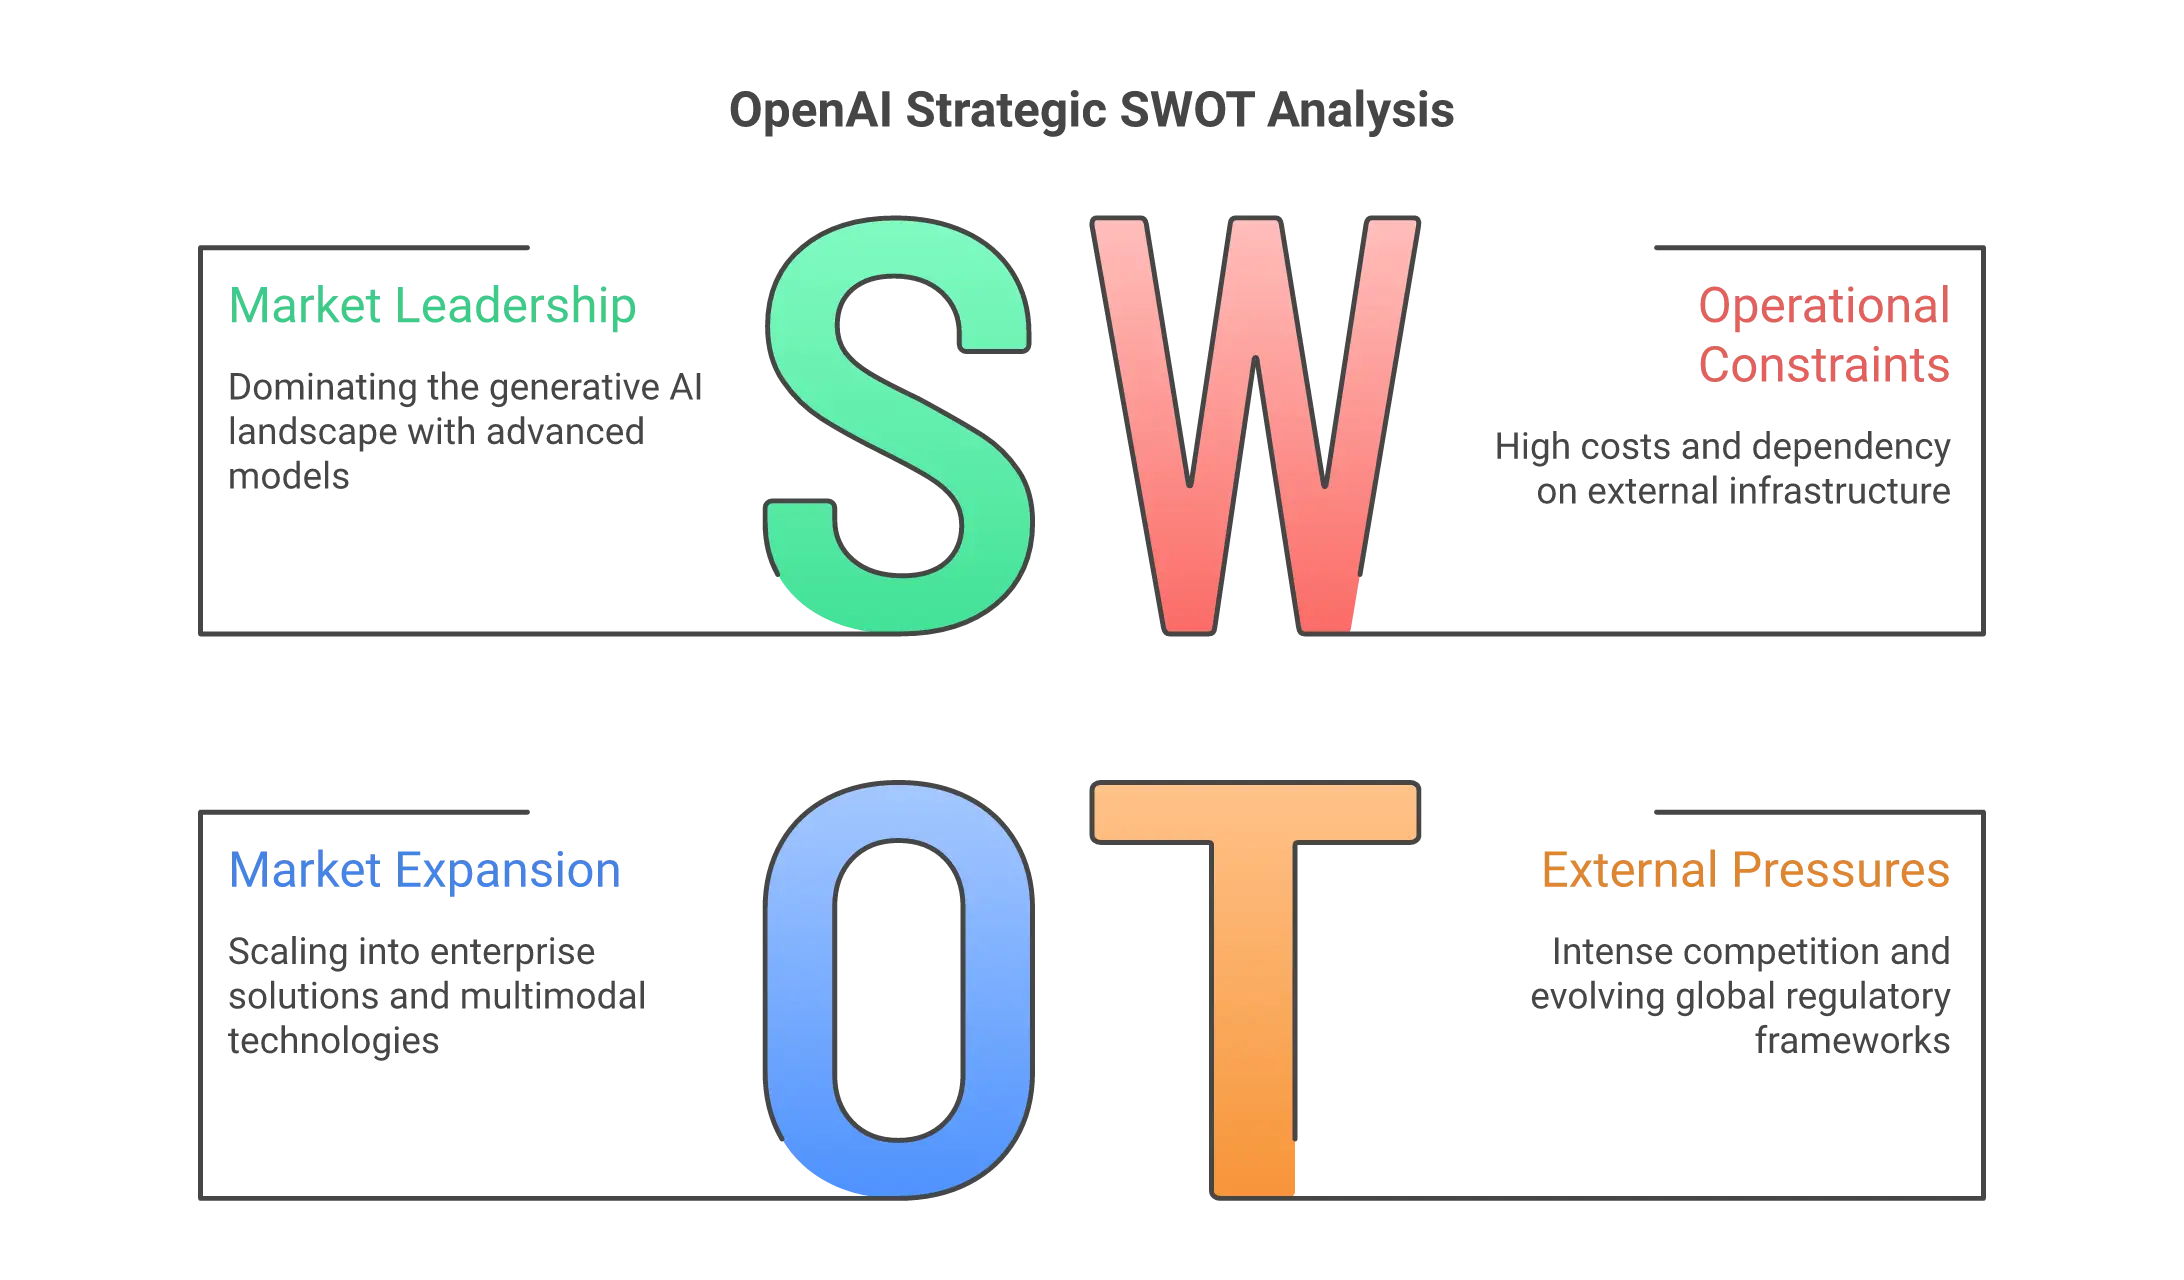
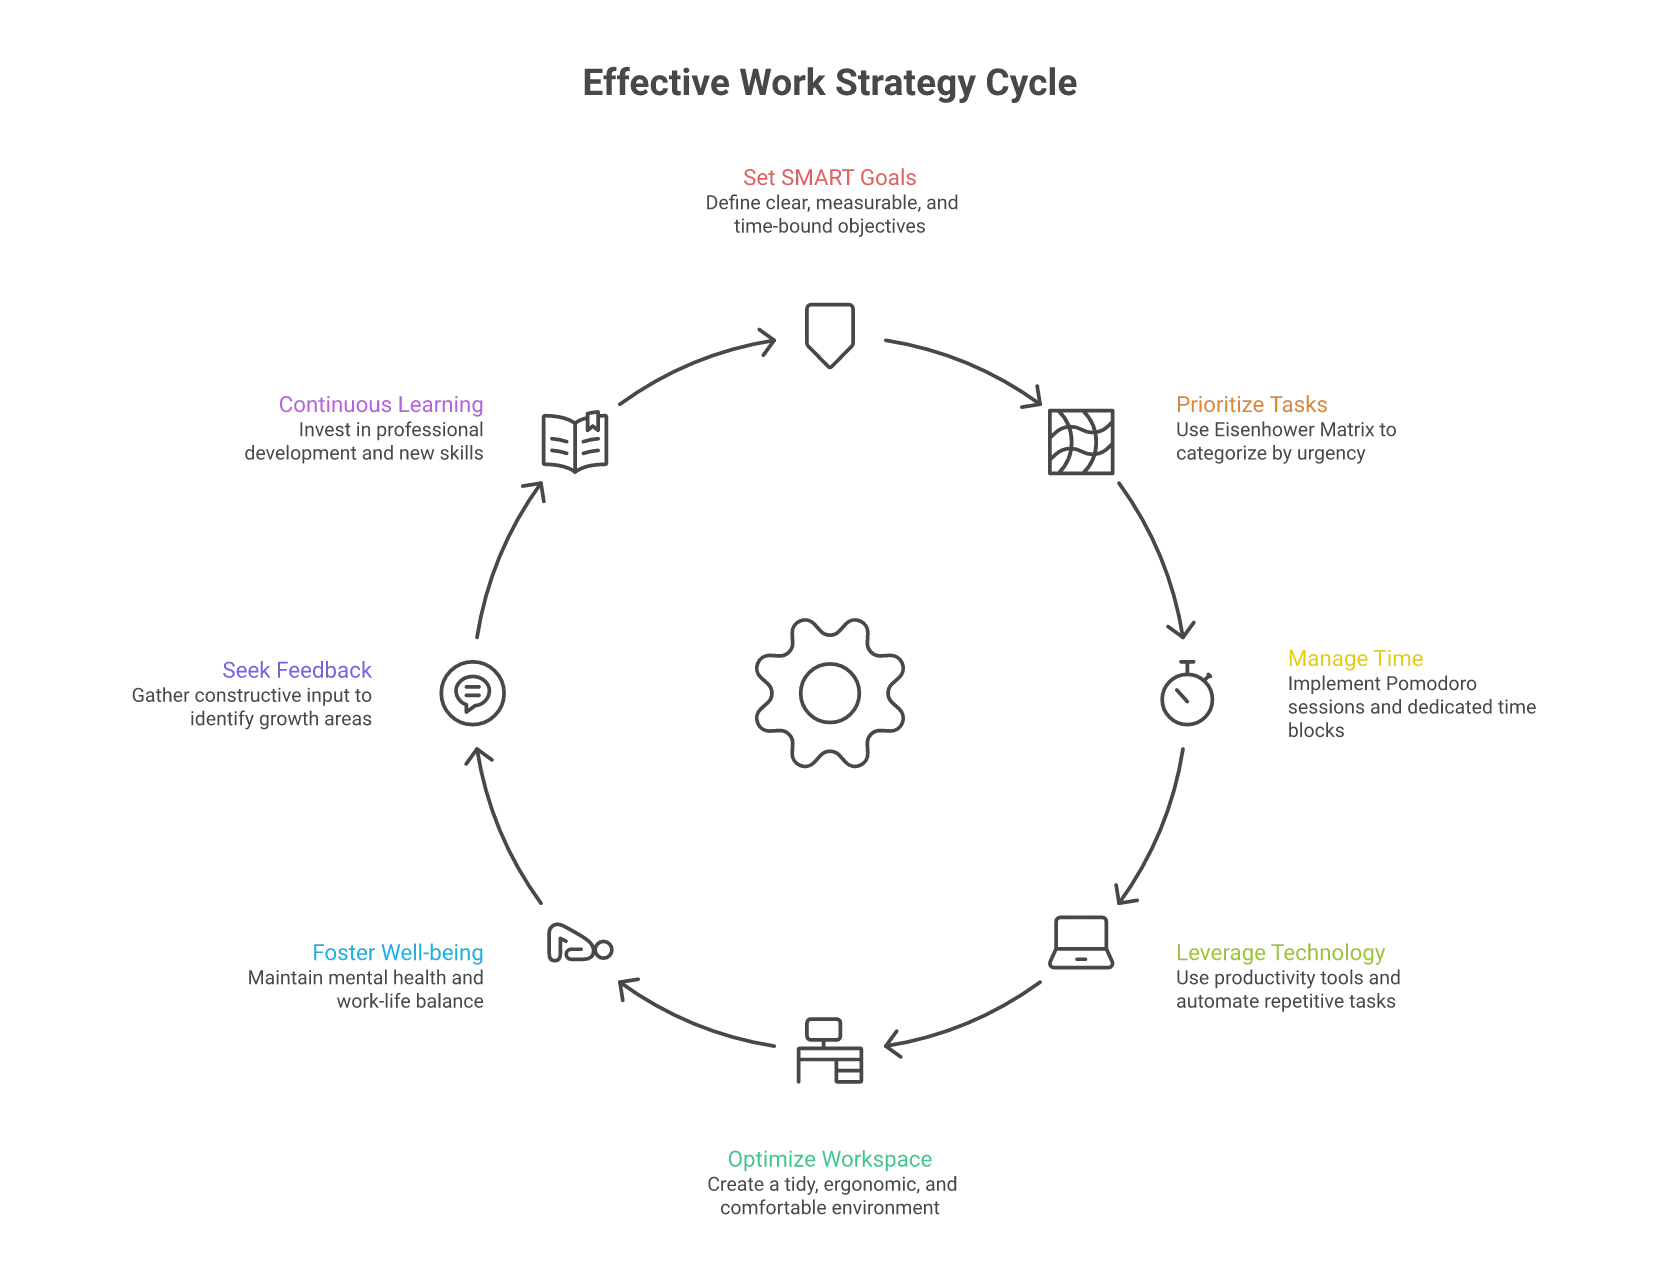
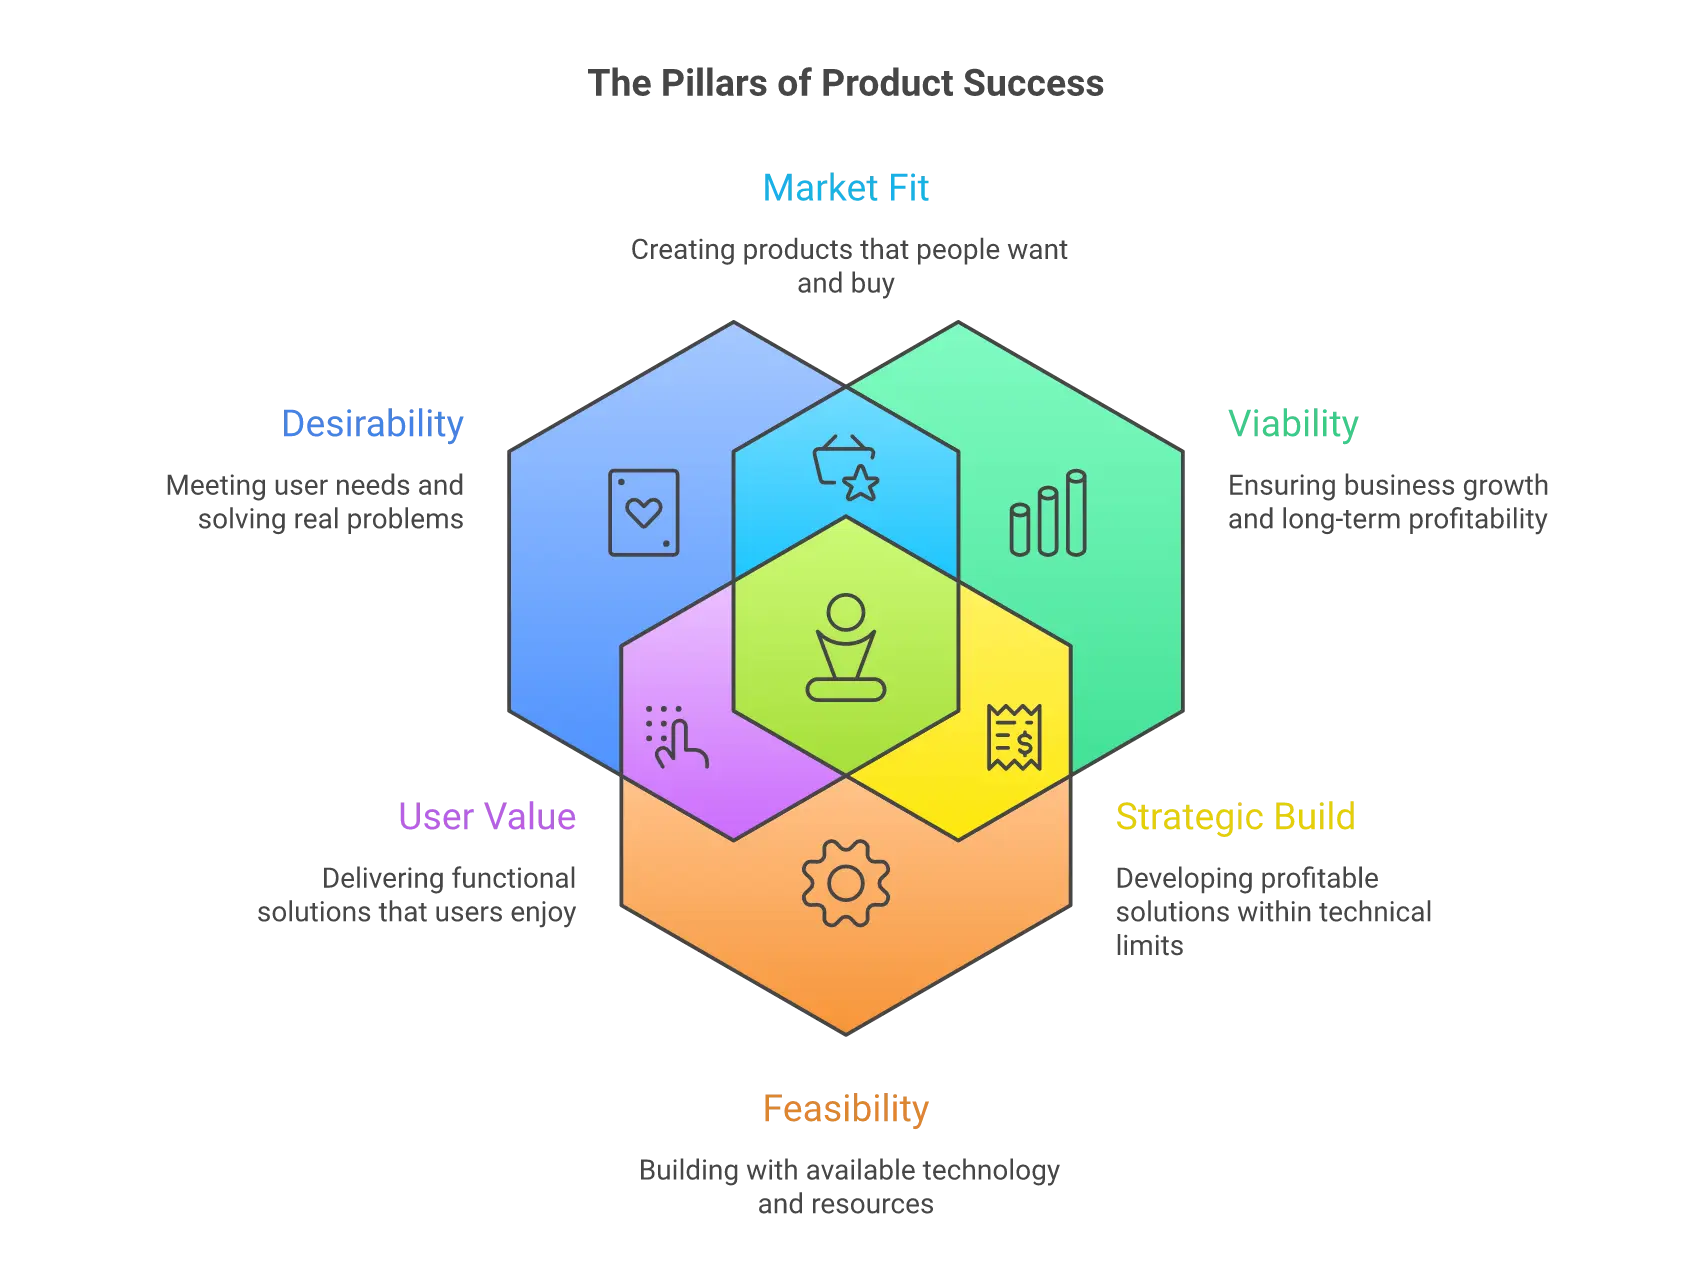
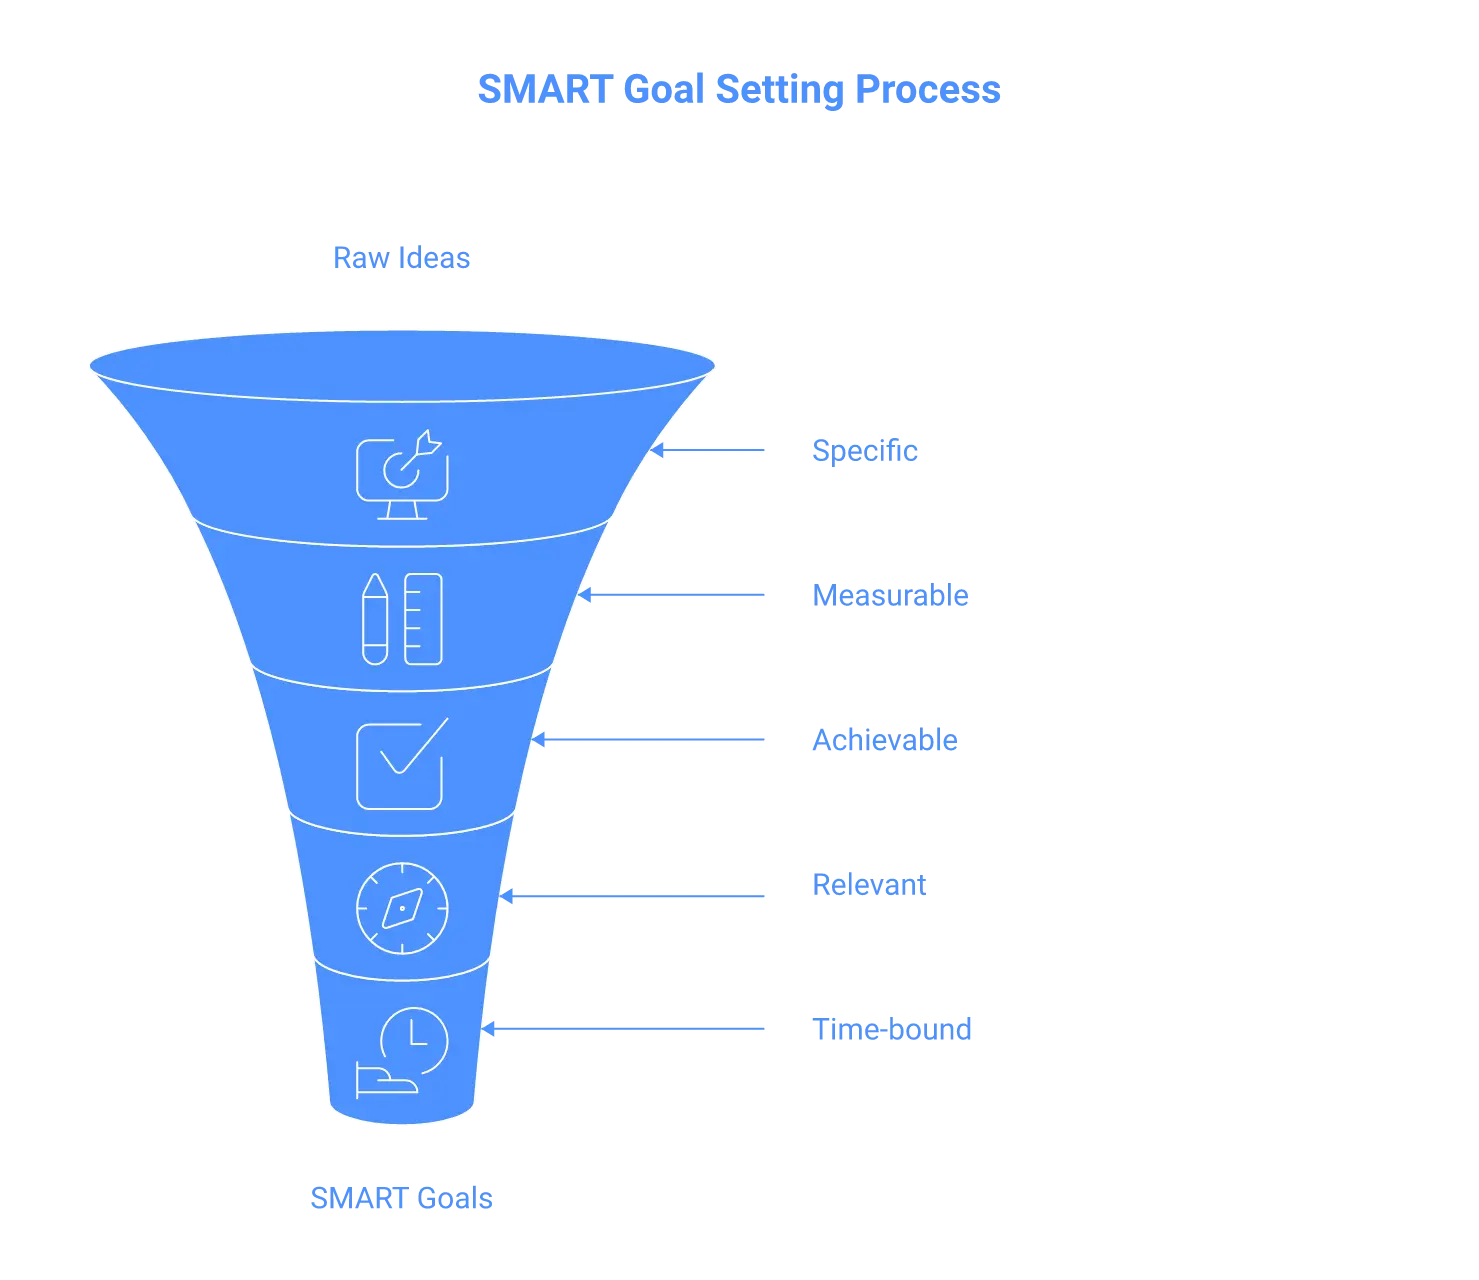
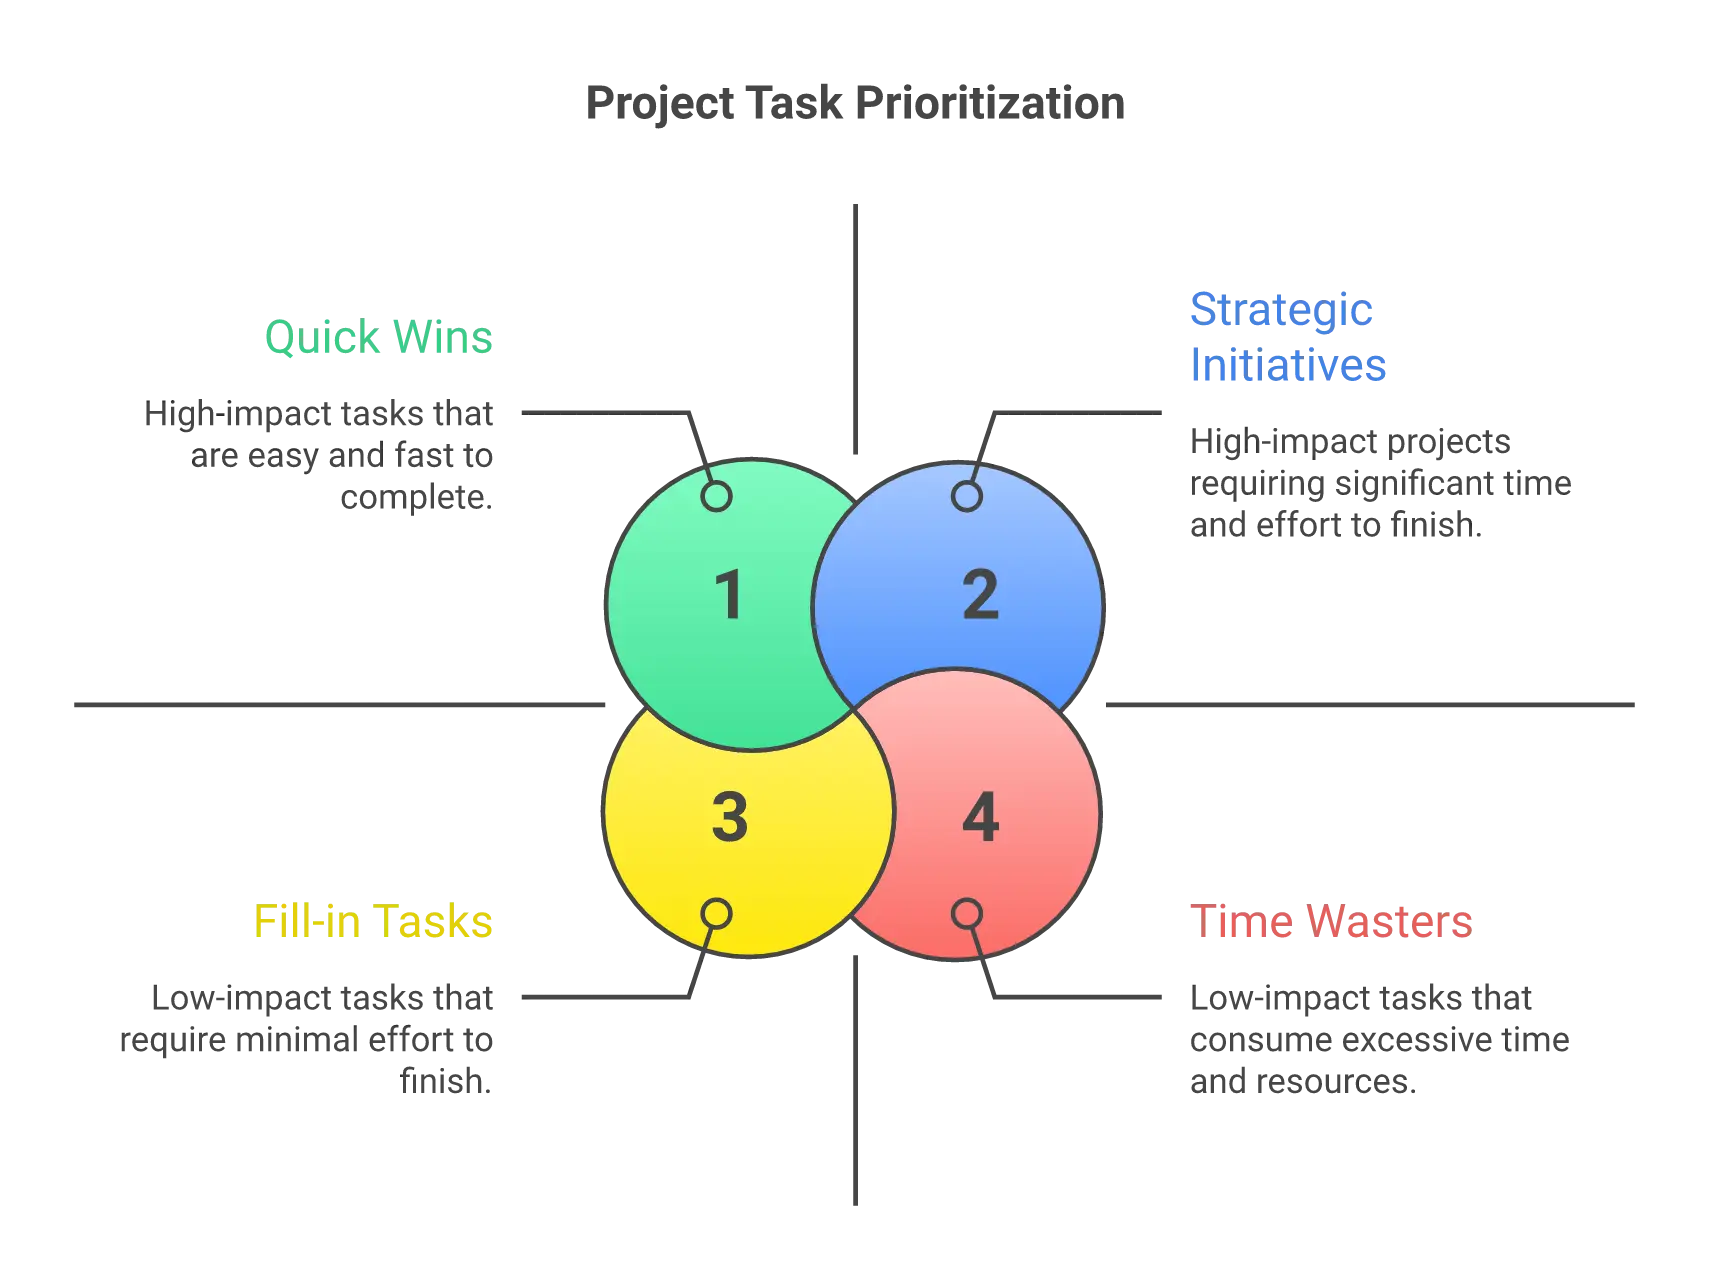
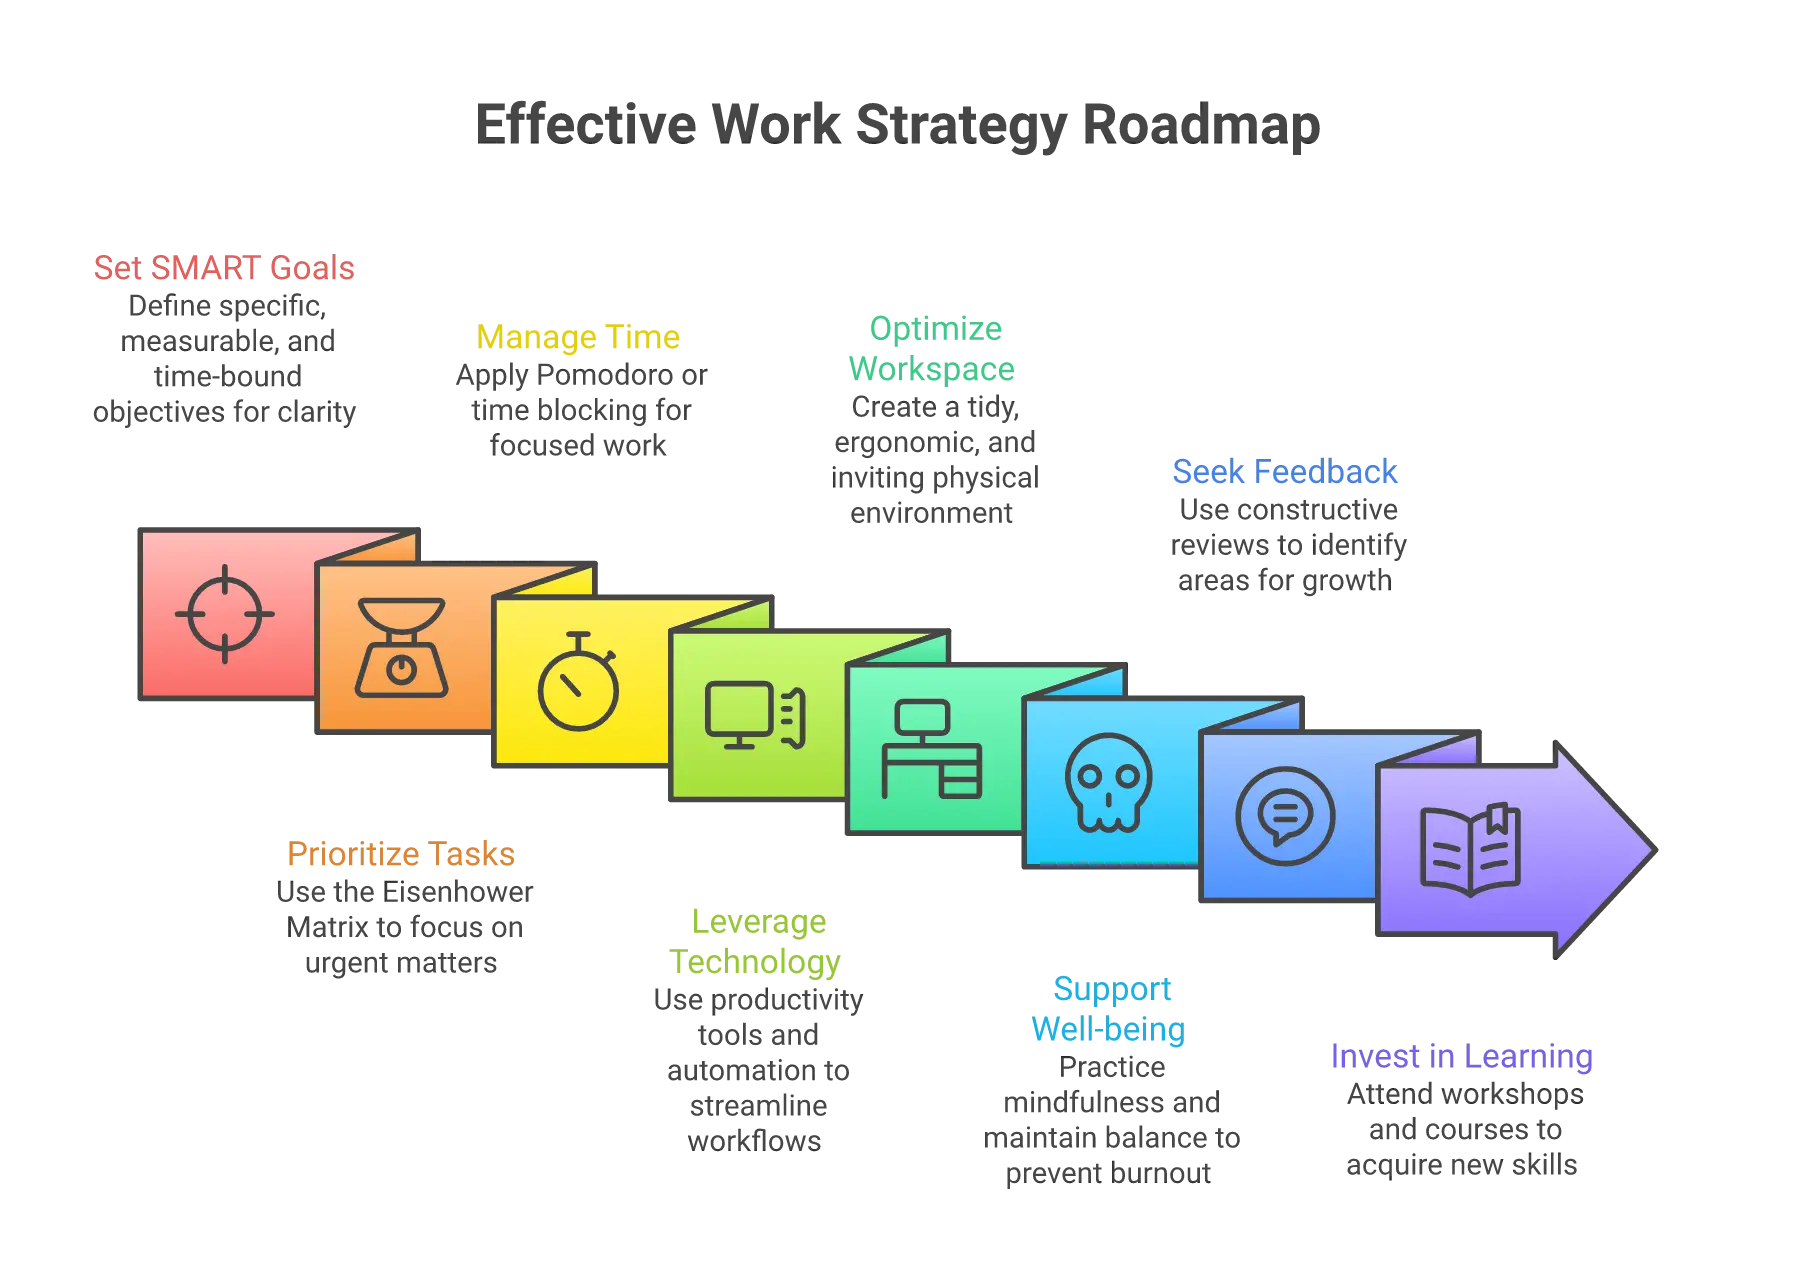
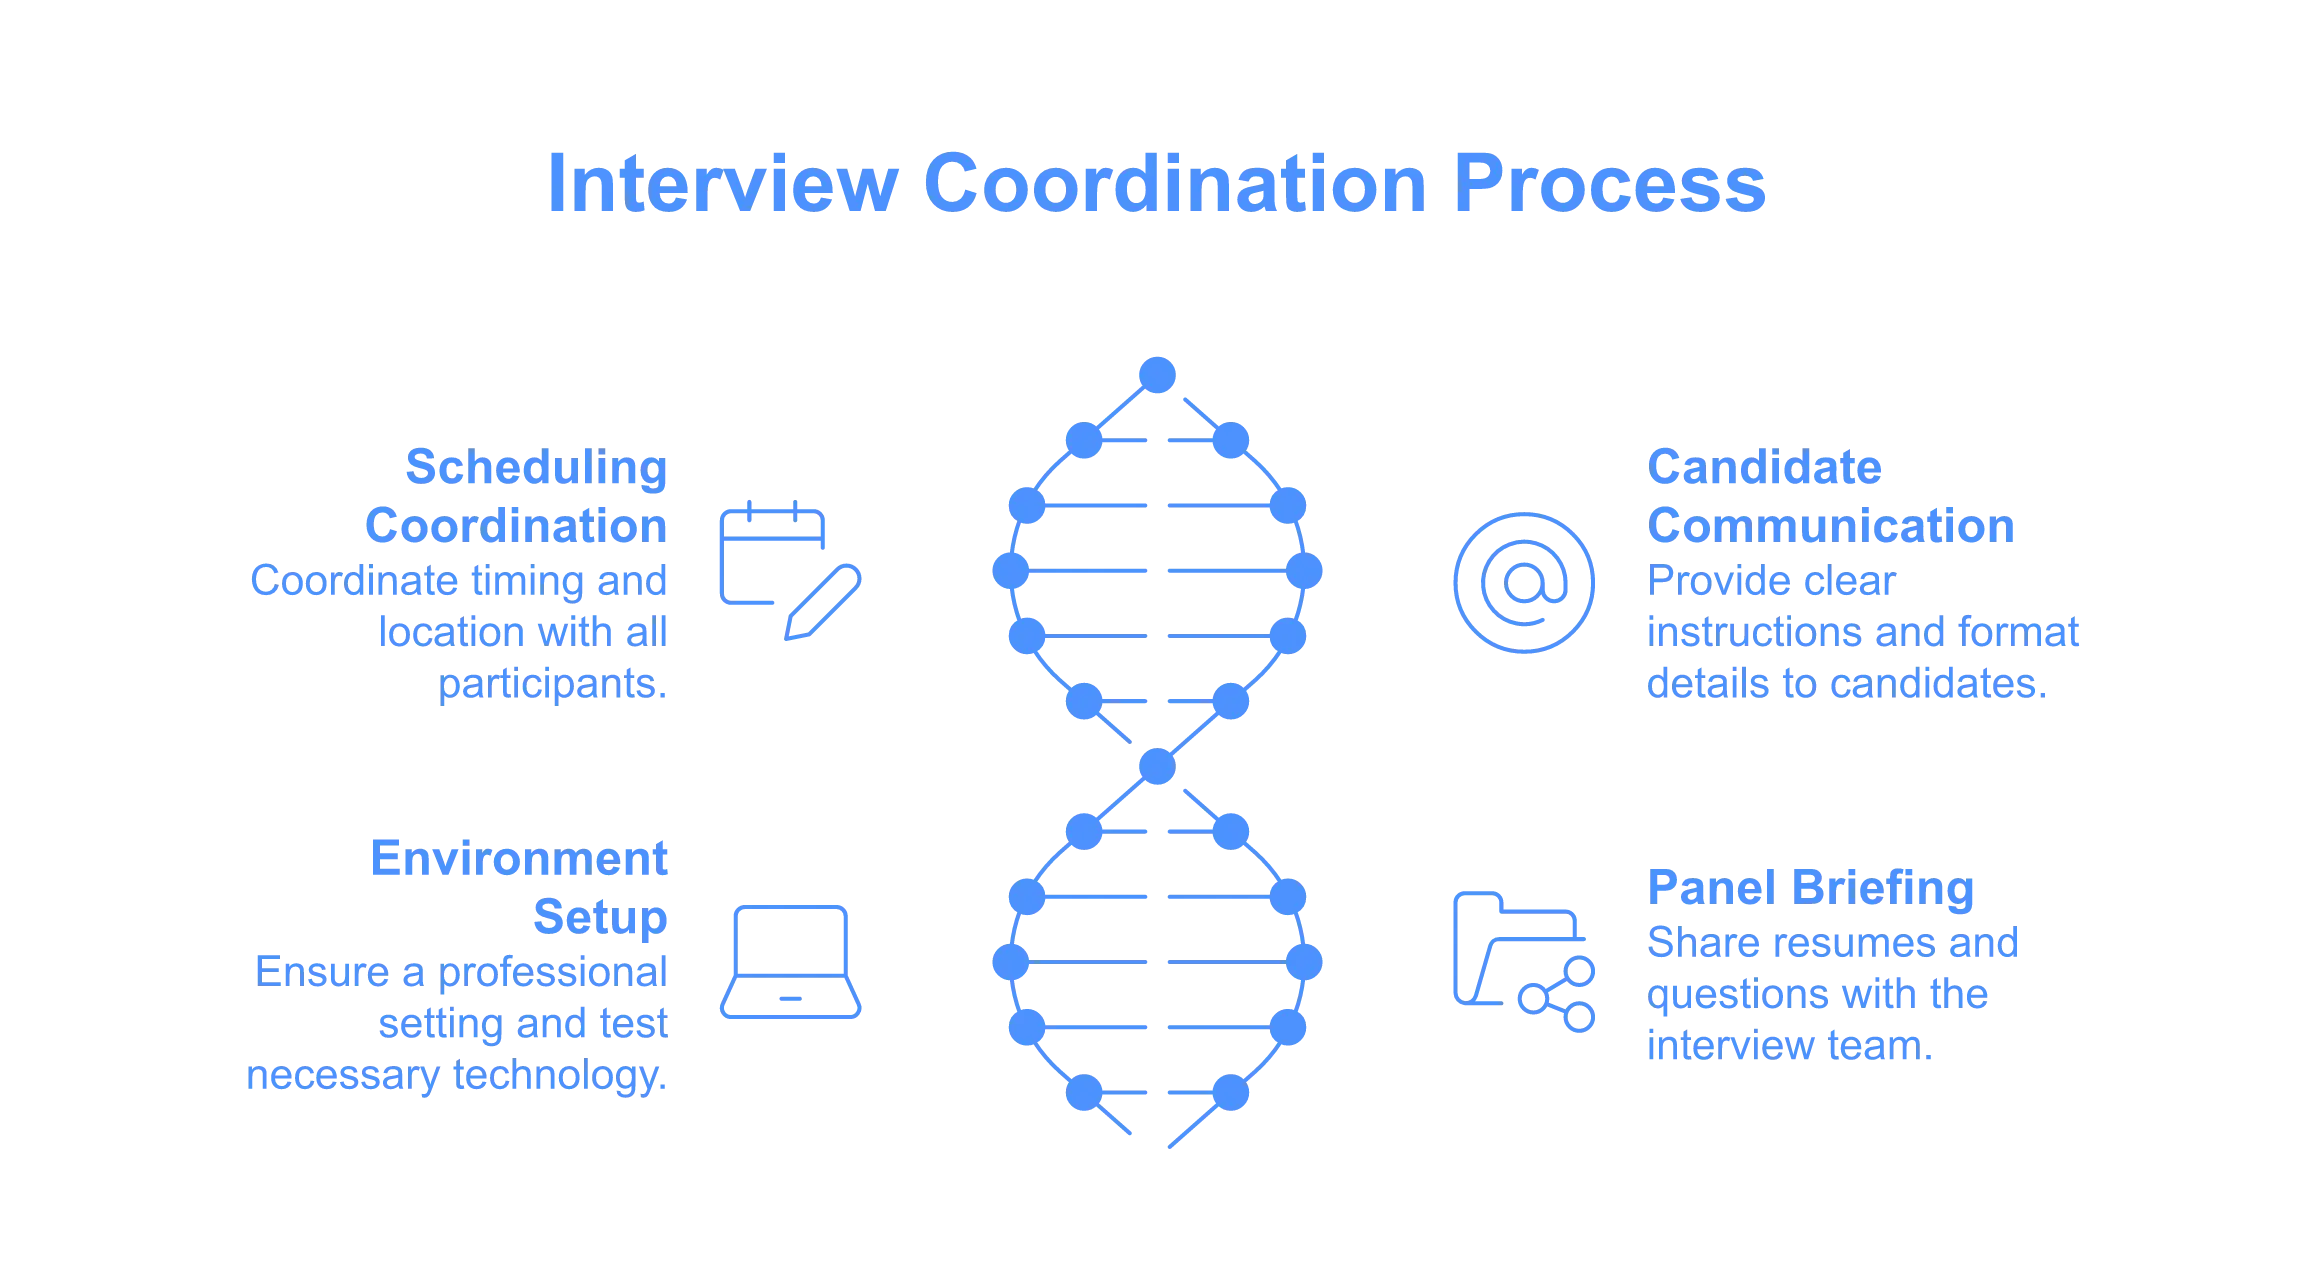
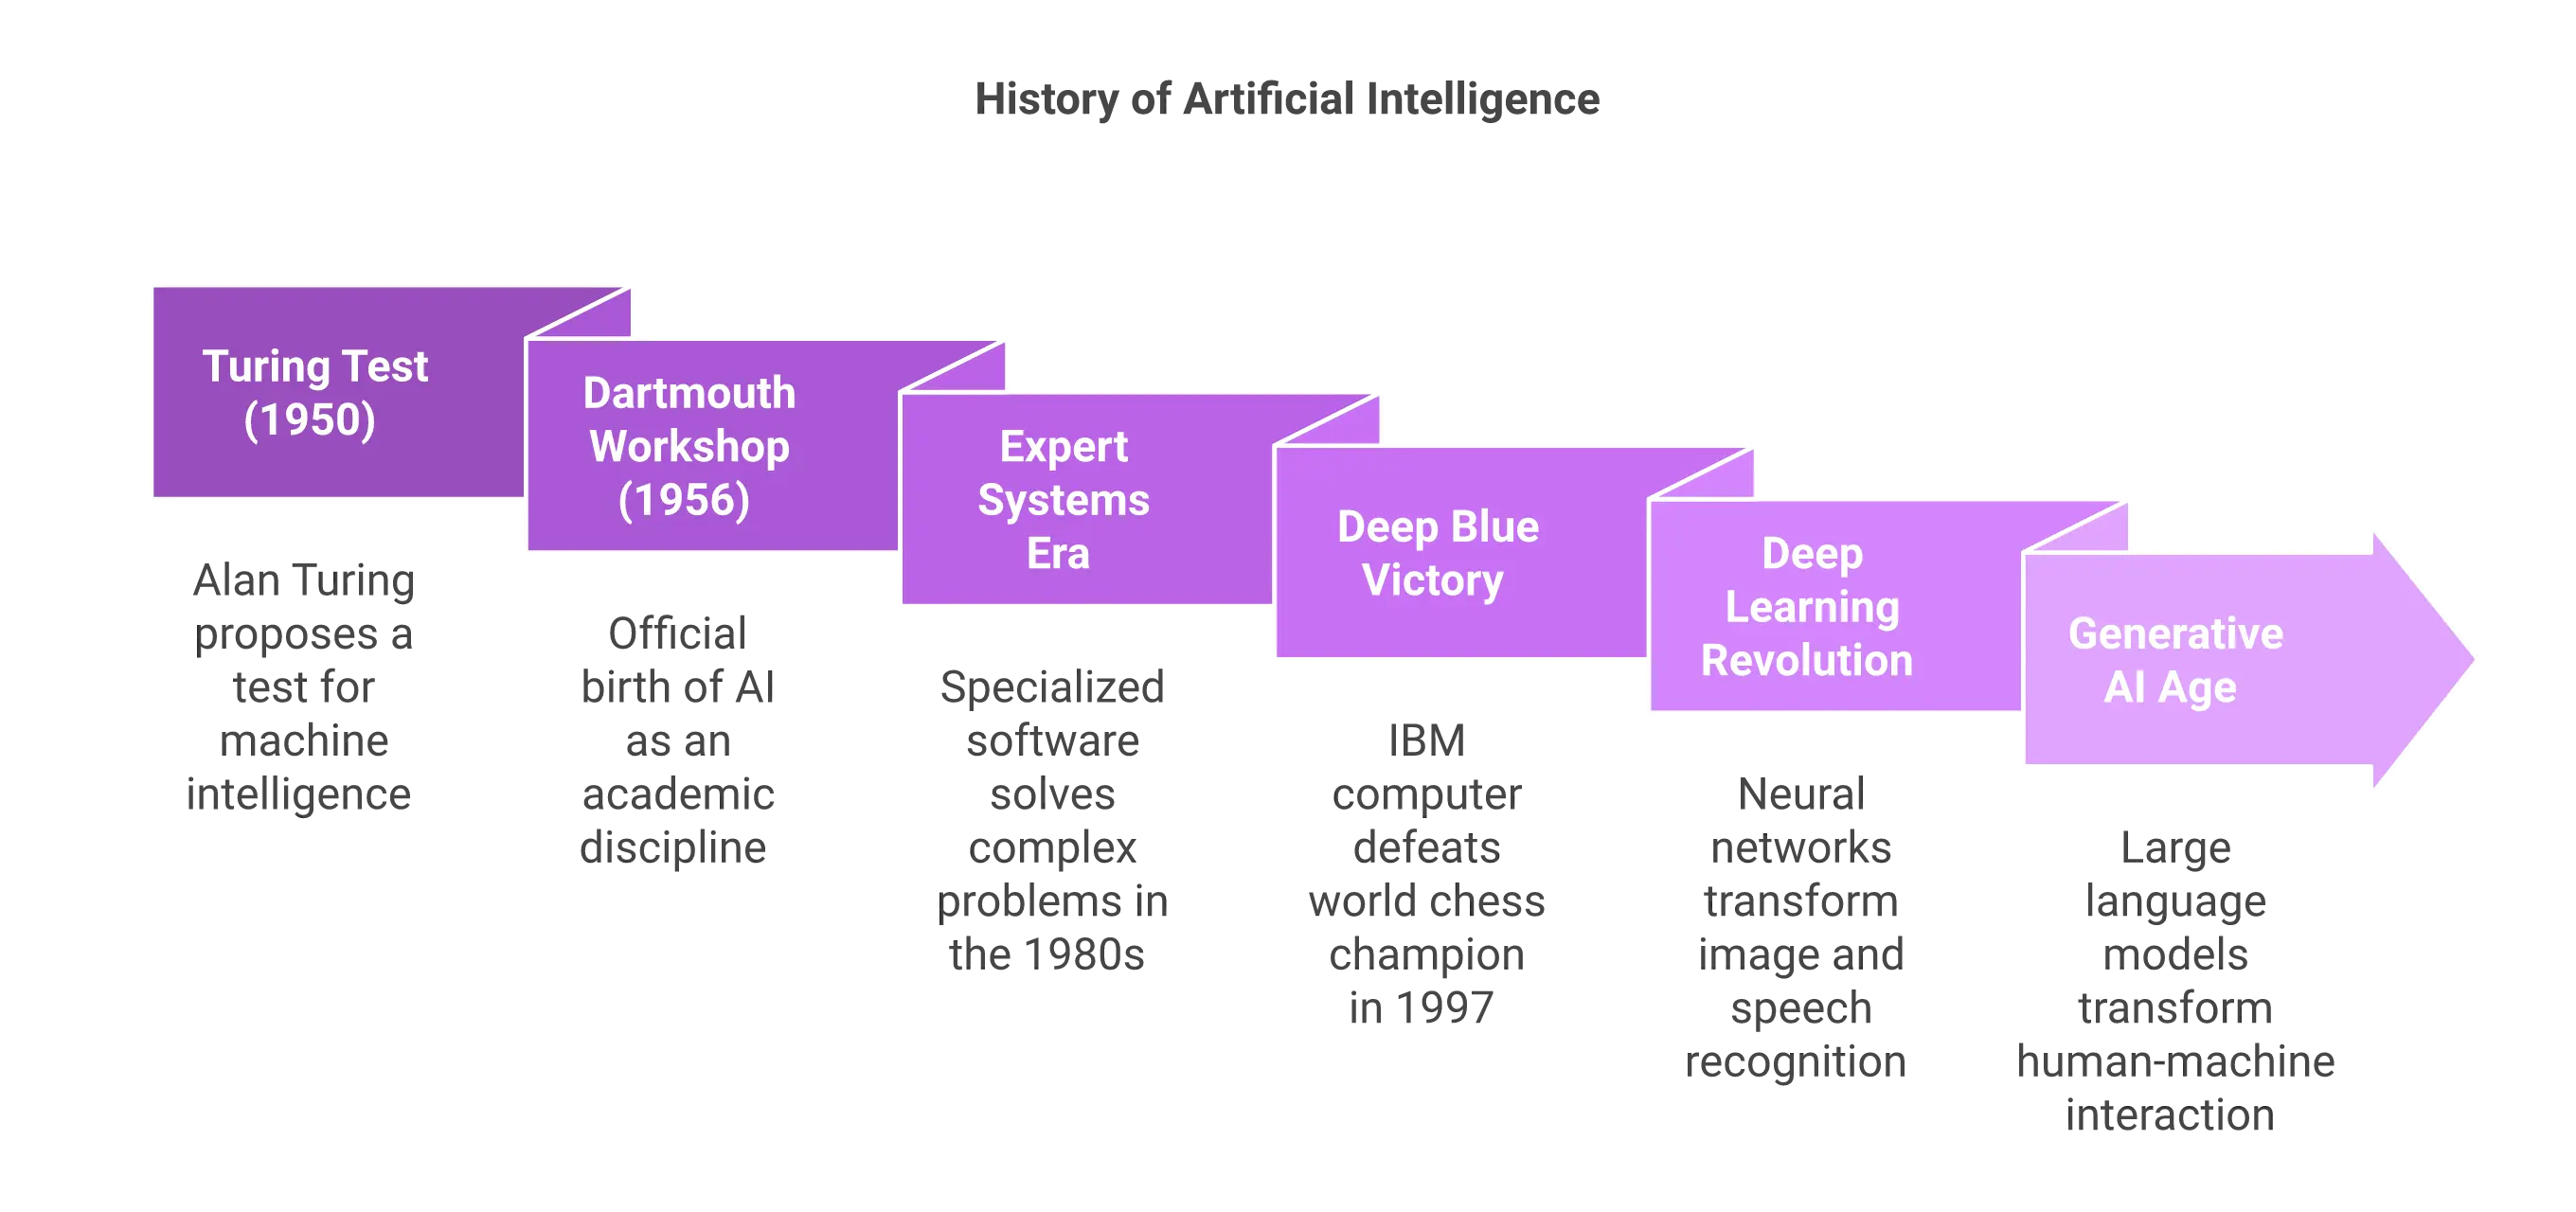
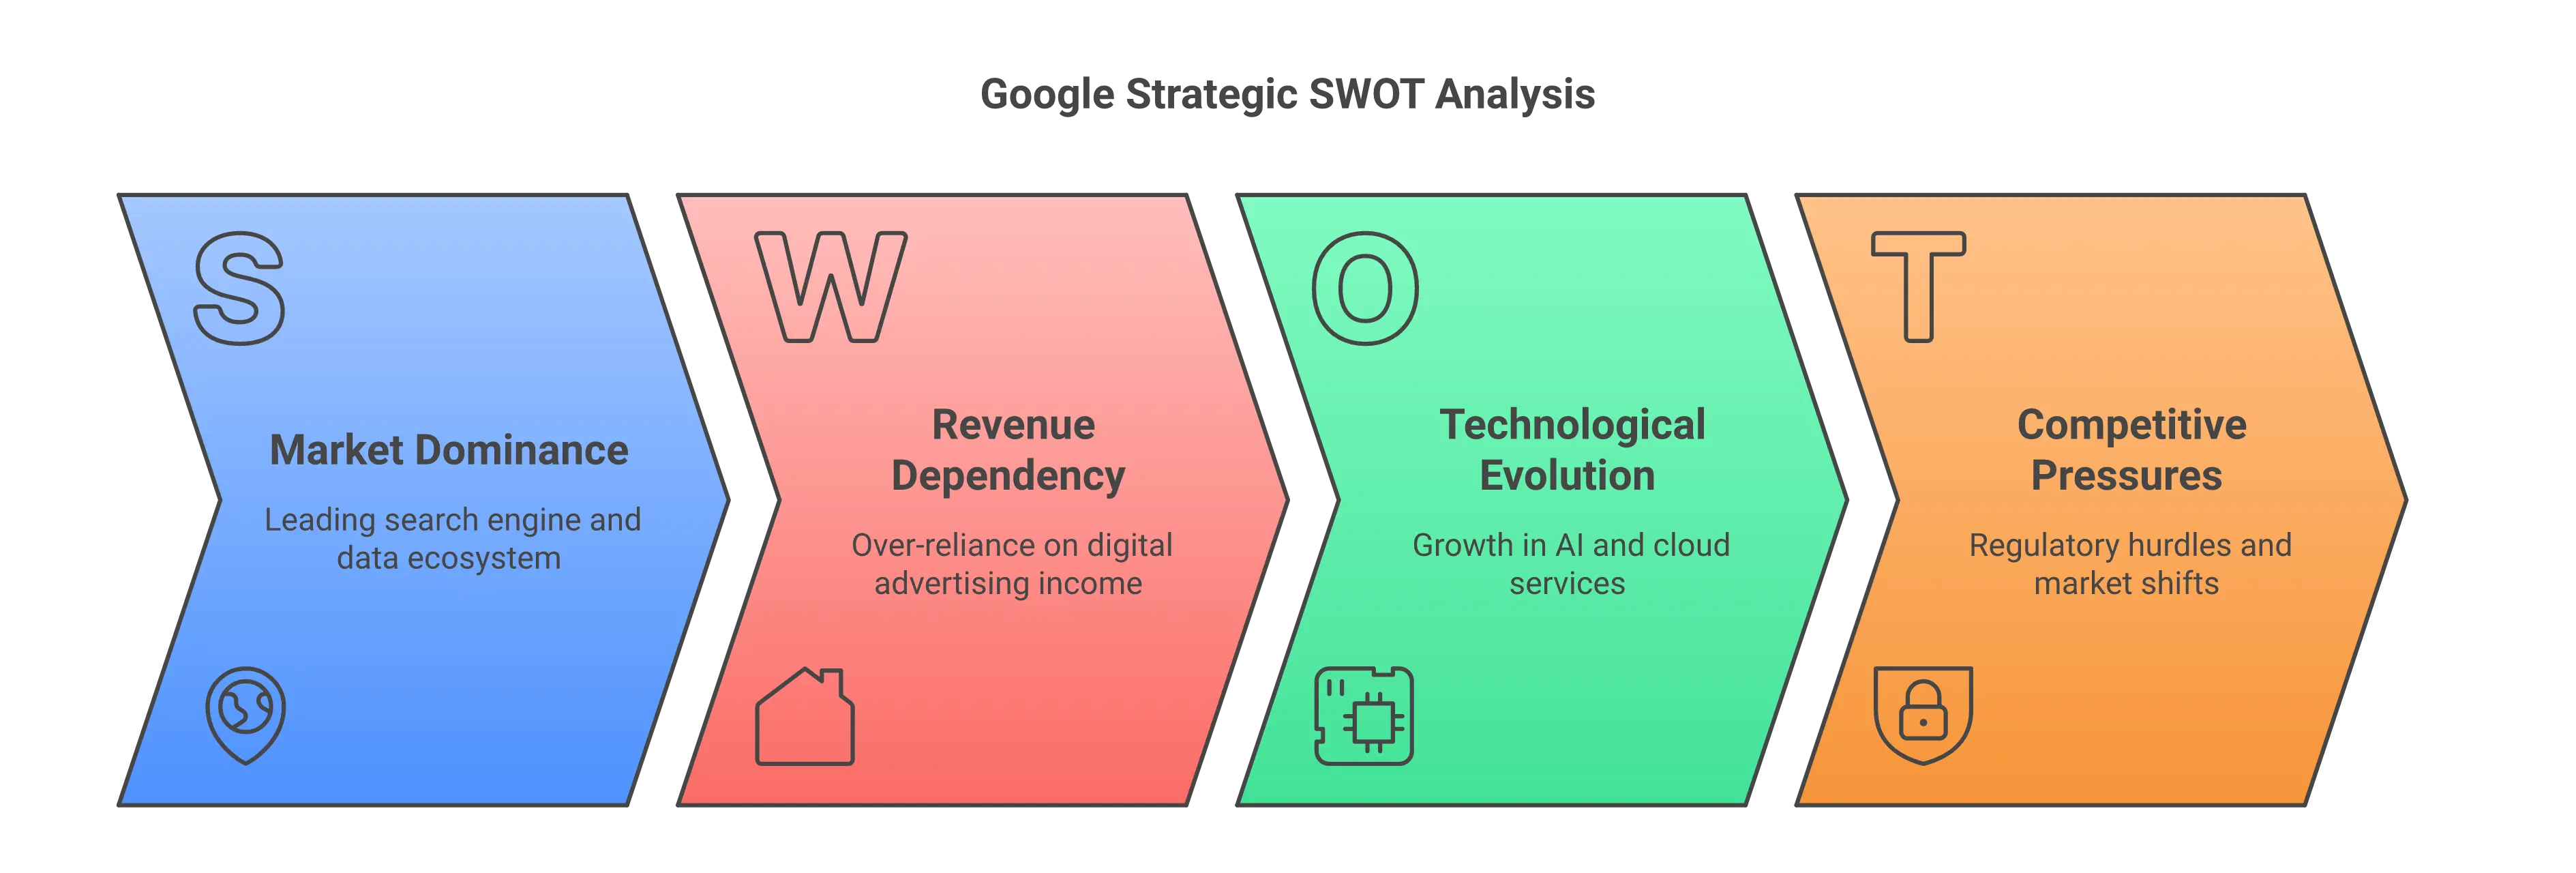
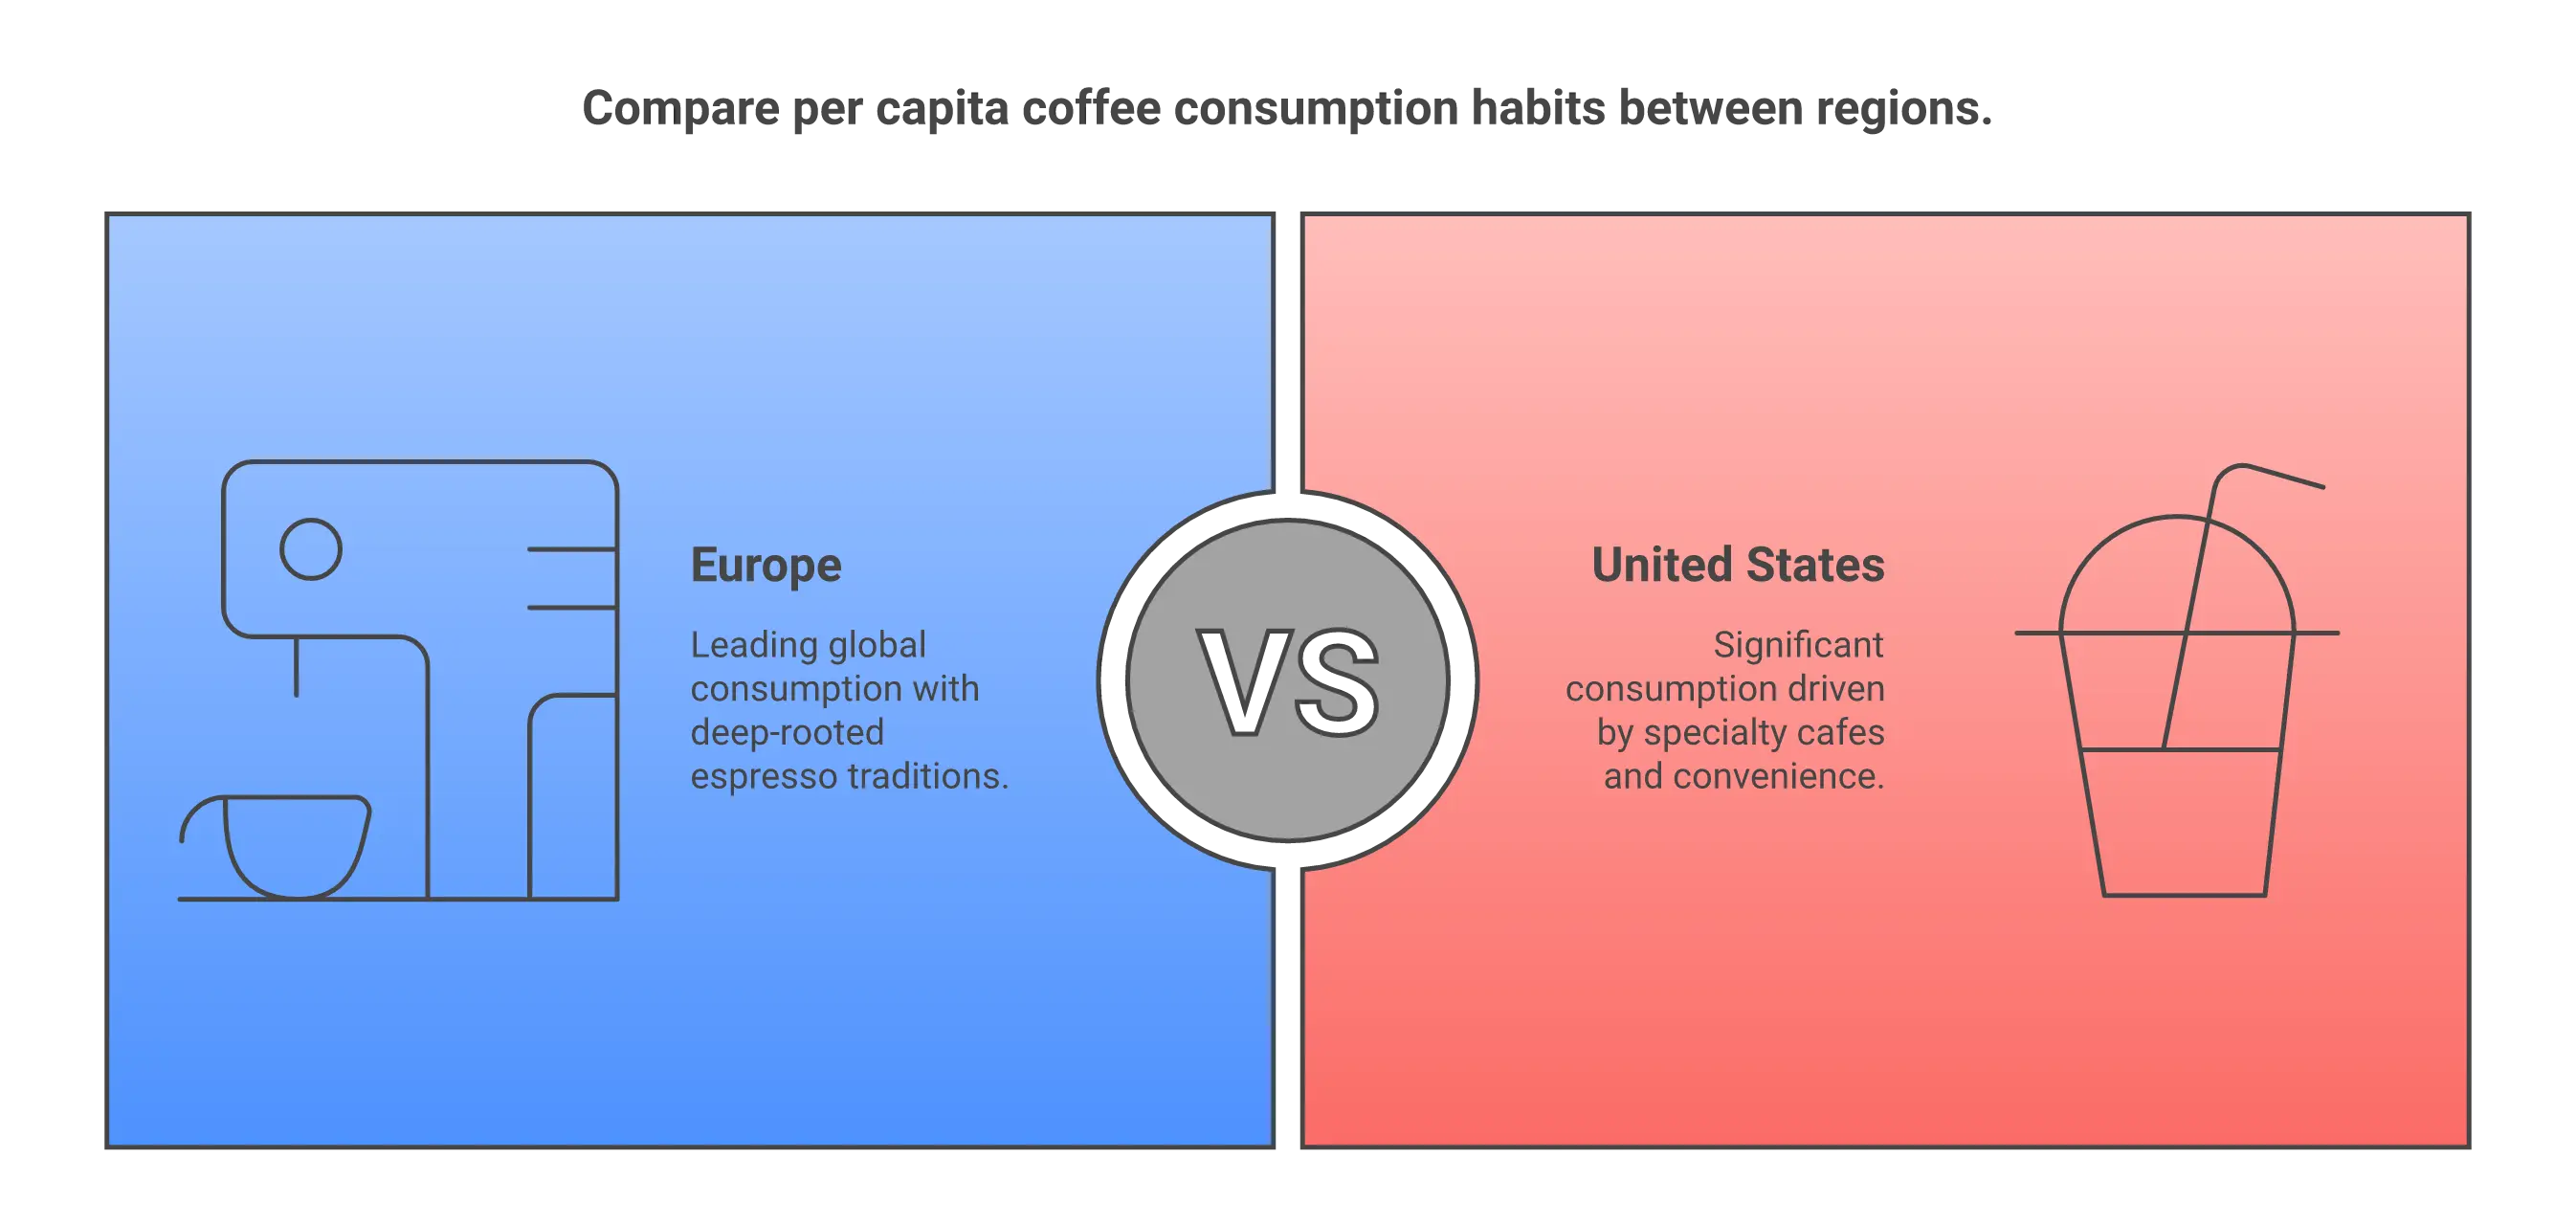
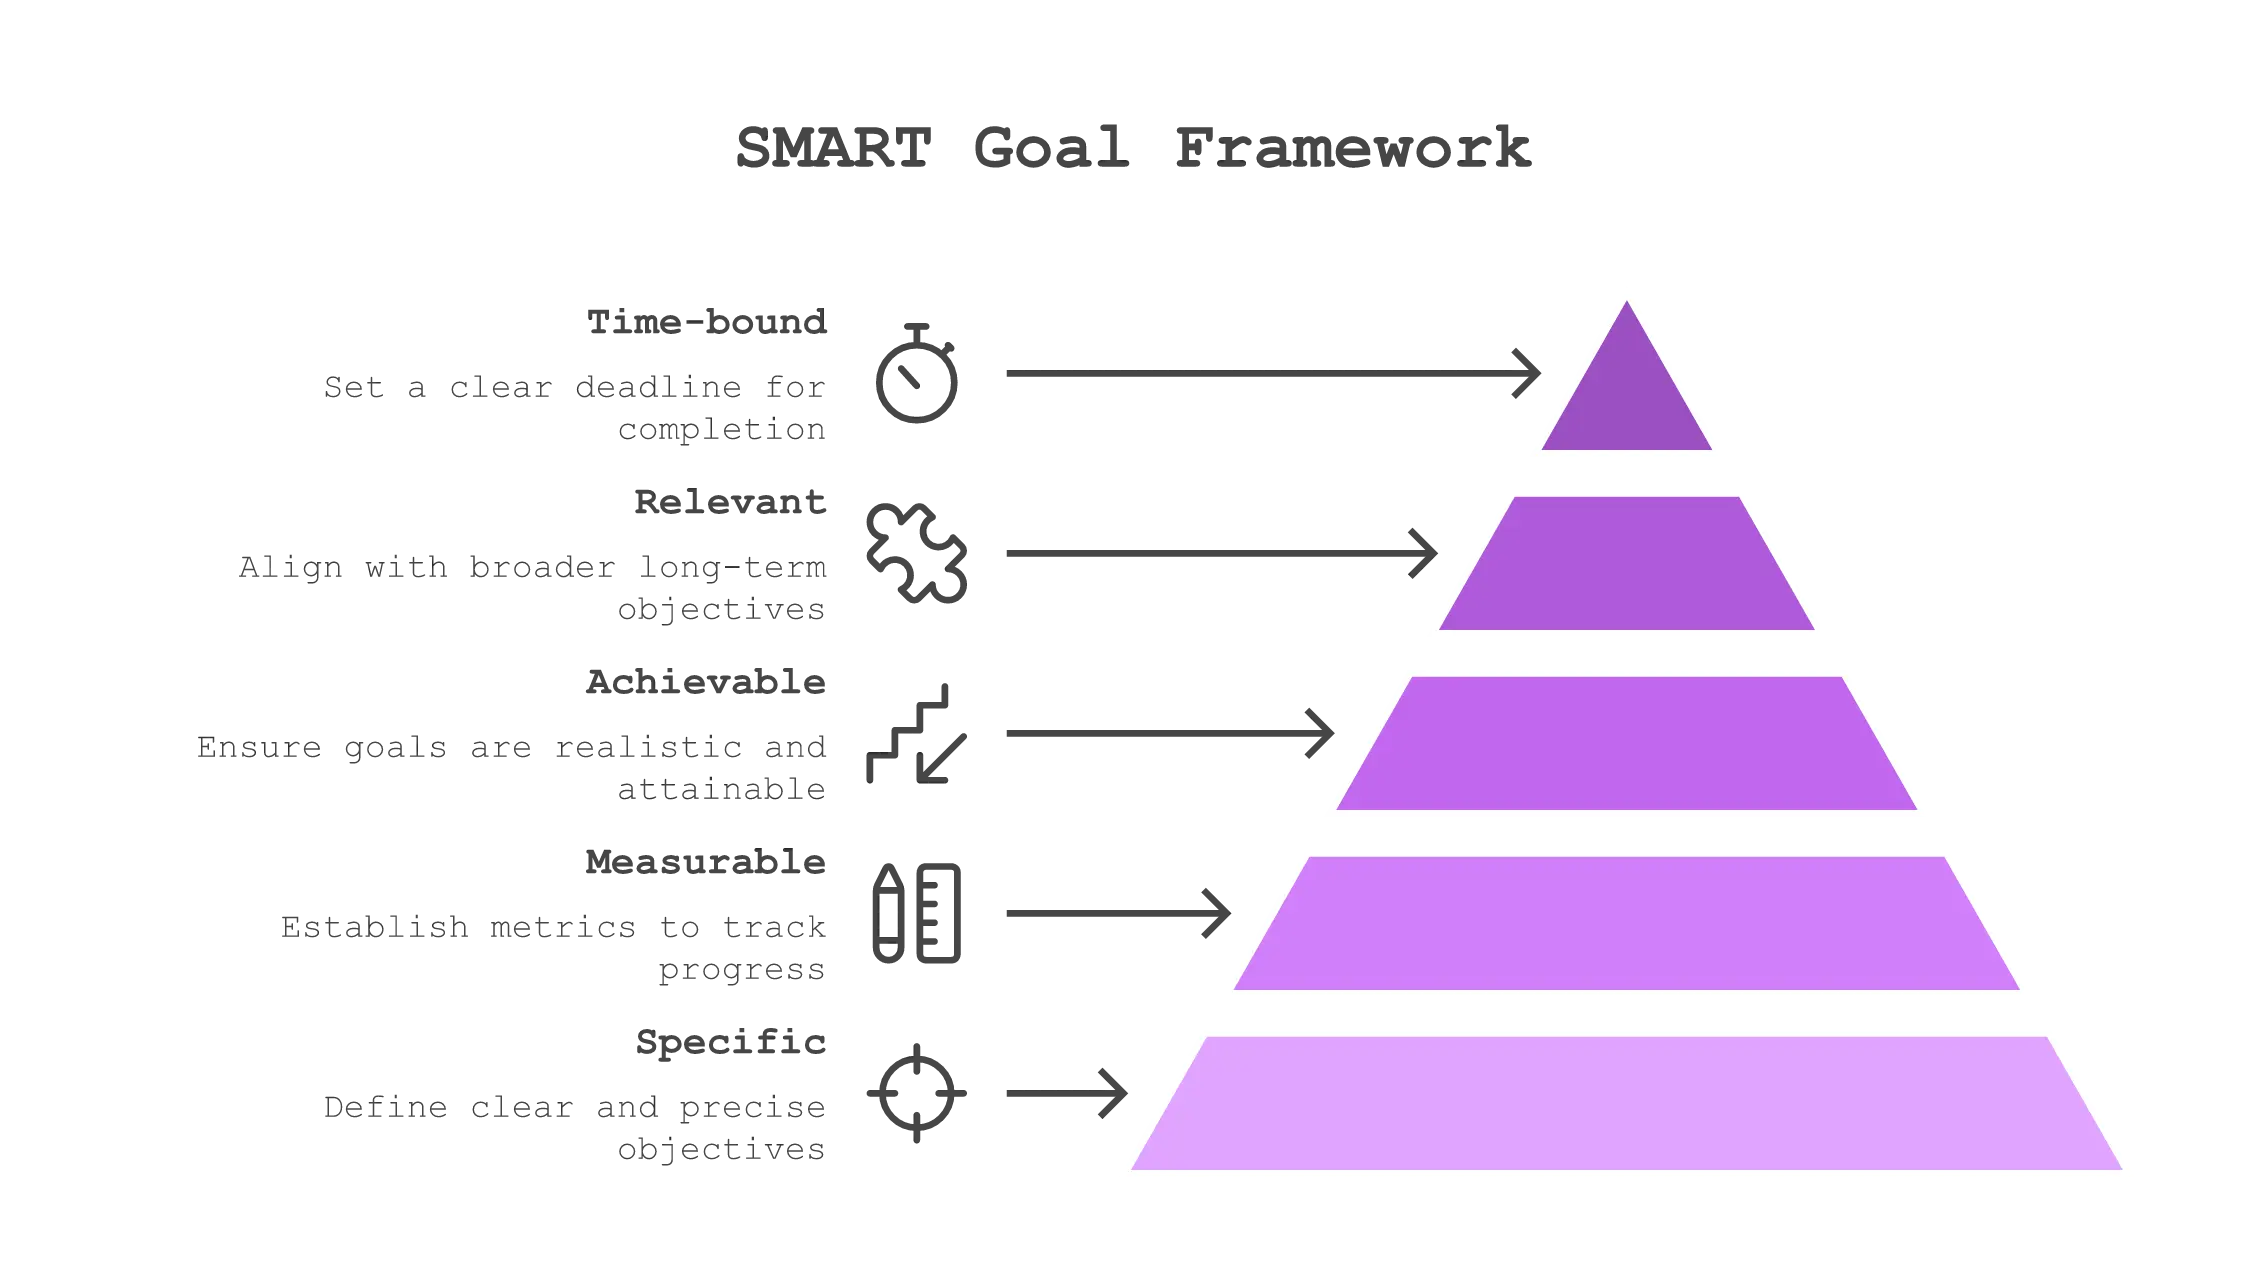
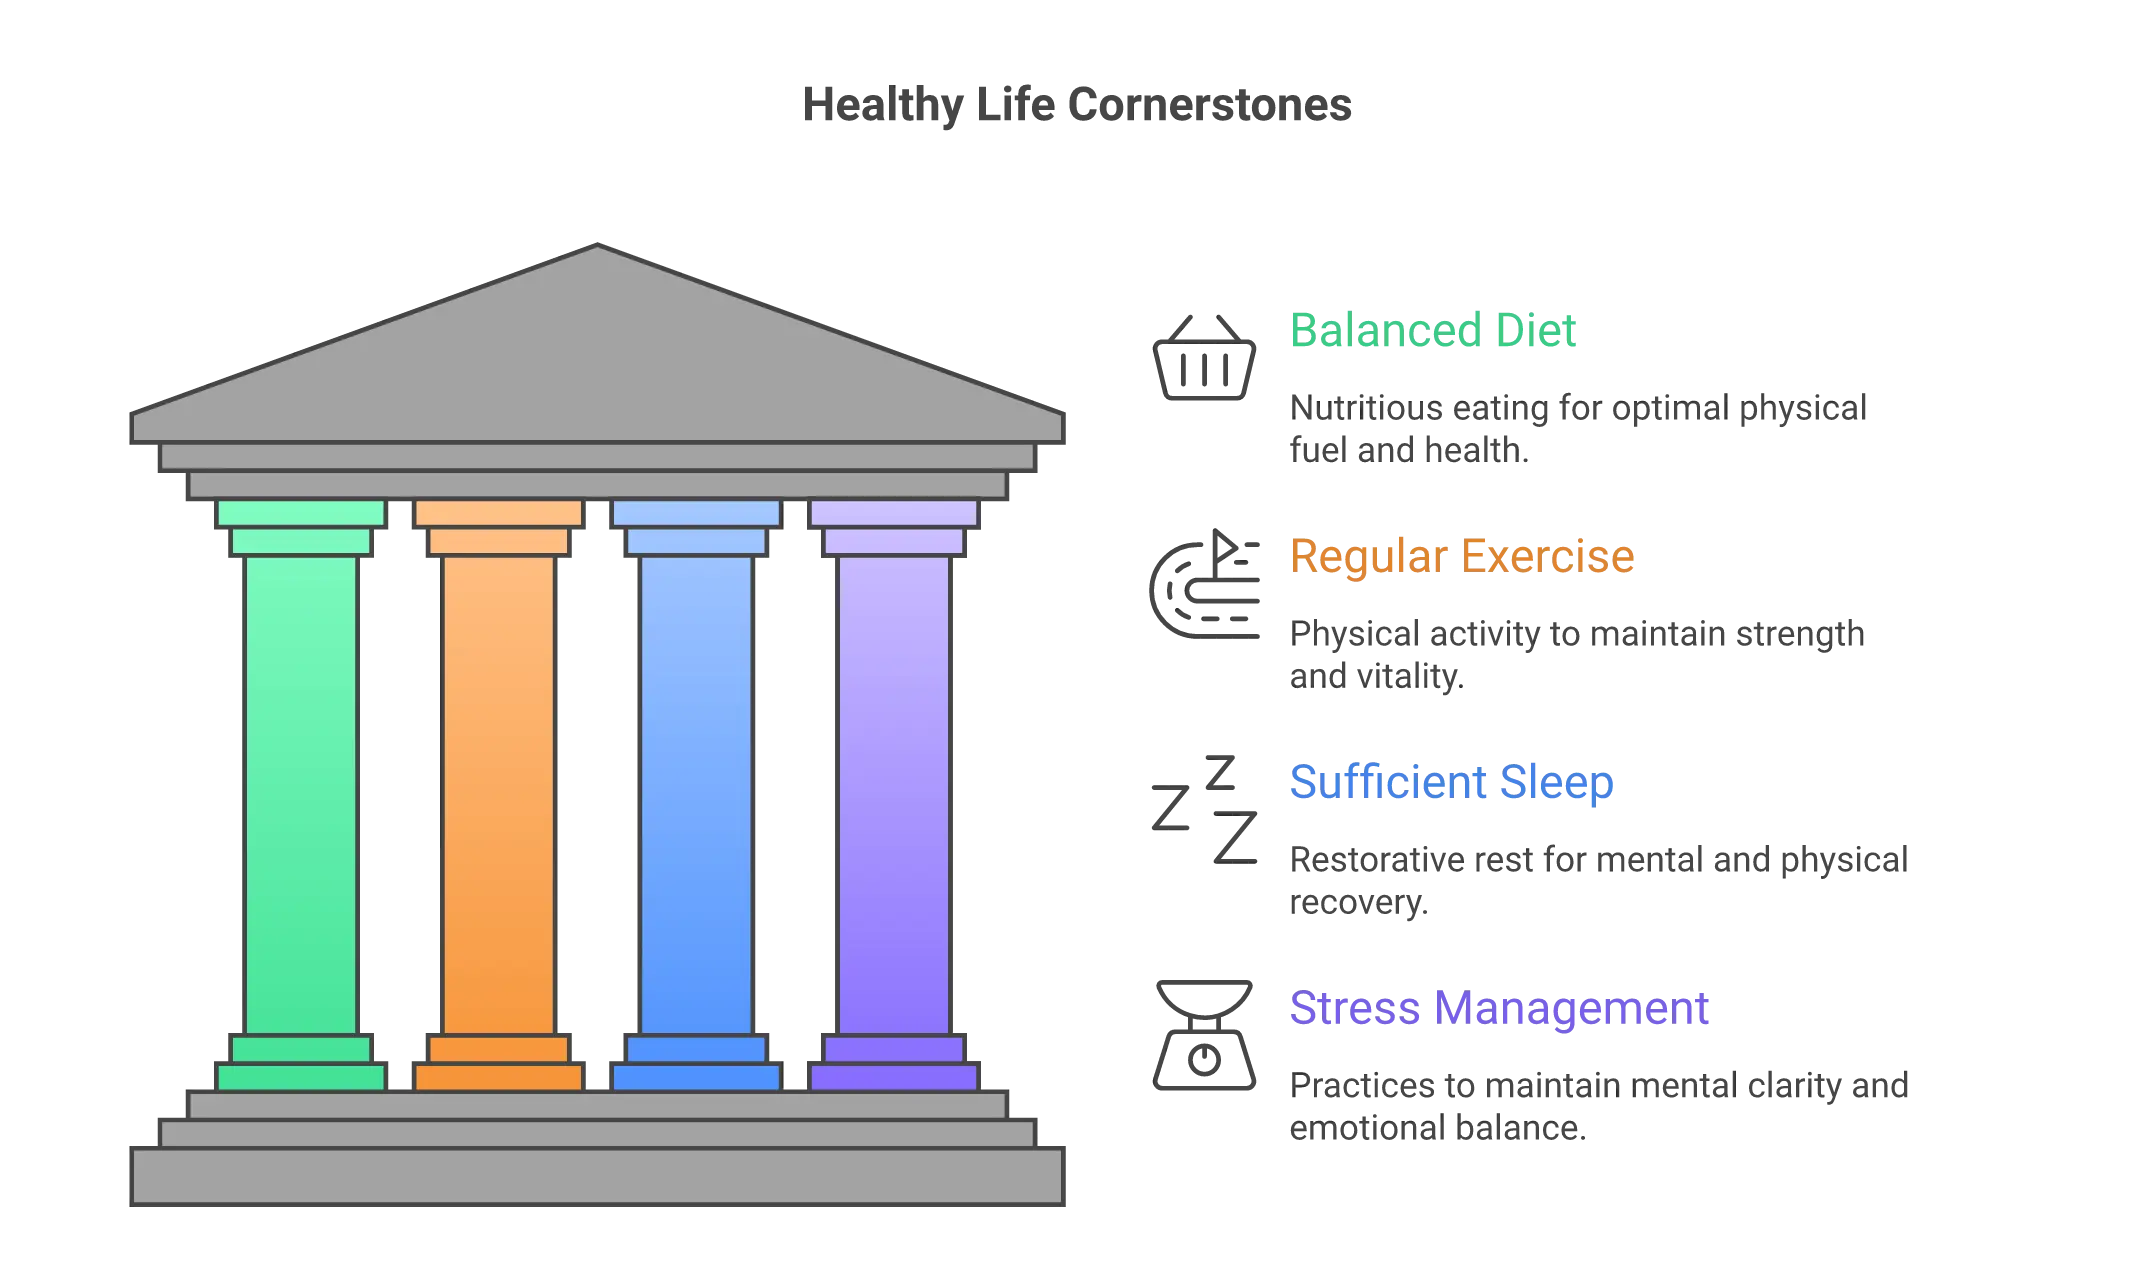
Stunning visuals, generated instantly

Here are a few visuals created on GenVisual.

Cycle diagram visualizing Effective Work Strategy generated by GenVisual
Pillar diagram illustrating The Pillars of Product Success created with GenVisual
SMART Goal Setting Process flow chart generated by AI
Project Task Prioritization matrix diagram created on GenVisual
Recruitment process visualization showing Effective Interviewing Cycle
Strategic roadmap diagram for Effective Work Strategy
Interview Coordination Process workflow chart generated by GenVisual
Timeline diagram illustrating the History of Artificial Intelligence
SWOT Analysis chart for Google Strategic Planning
Data comparison chart showing Per Capita Coffee Consumption by Region
SMART Goal Framework visualization created with GenVisual
Infographic illustrating Healthy Life Cornerstones

Visuals for every use case

Whether you're presenting to a board or writing a blog post, GenVisual has you covered.

Presentations

Create engaging slides that tell a story with data and visuals.

Documentation

Make your technical docs easier to understand with clear diagrams.

Social Media

Share bite-sized visual content that drives engagement.

Lightning Fast

Generate visuals in seconds, not hours. Focus on your message.

Ready to visualize your ideas?

Start creating professional visuals from your data in seconds. No credit card required.

Frequently Asked Questions

Have another question? Contact us at support@genvisual.net

Our advanced AI analyzes your text to understand the key concepts and relationships. It then selects the most appropriate diagram type (pillar, funnel, timeline, etc.) and automatically generates a professional visual representation.

Yes, you can get started for free. We offer a generous free tier that allows you to generate a limited number of visuals per day. For unlimited generation and advanced features, you can upgrade to our Premium plan.

Absolutely! After generation, you can change the theme and font to match your brand. In the near future, we will also provide more flexible editing features, such as editing text and structure.

You can export your visuals in high-quality PNG and SVG formats. SVG is perfect for editing in other vector tools like Figma or Illustrator.

Yes, all visuals you generate are yours to use for any purpose, including commercial projects, presentations, and publications.